A fan datasheet is just a table of numbers until you know what those numbers are measuring -- and picking the wrong fan based on a misread spec is an easy mistake that costs real time to correct.
A cooling fan datasheet encodes the four specs that determine whether a fan fits an application: airflow volume, static pressure, noise level, and rotational speed -- plus a P-Q curve that shows how all four interact. Reading these correctly at the selection stage prevents mismatches that don't surface until a system is already built.
- Airflow (CFM or m³/h) tells you how much air a fan can move in open conditions, but that number drops as system resistance increases -- it's a ceiling, not a flat guarantee.
- Static pressure (Pa or inH₂O) tells you how hard a fan can push against resistance, and it determines whether the fan can actually function inside a restrictive enclosure, filter, or duct.
- Noise (dBA) and speed (RPM) are tightly linked -- RPM drives both airflow and noise, and the spec sheet's single dBA figure is measured under one specific test condition, not across all operating points.
- The P-Q curve is the most information-dense item on any datasheet, showing how airflow and static pressure trade off against each other across the fan's full operating range.
- Bearing type, voltage range, and startup voltage are supporting specs worth checking, but they only matter after the core airflow/pressure/noise triangle is confirmed to fit.
Every number on a datasheet is answering a specific engineering question. Understanding which question each number answers -- and what it deliberately doesn't tell you -- is the fastest way to stop treating fan selection as guesswork.
Table of Contents
Why Does Reading a Datasheet Correctly Actually Matter?
Engineers who skip the datasheet and pick fans by diameter or price alone tend to discover the mismatch after the system is assembled.
A datasheet is the contractual record of a fan's performance under defined test conditions, and misreading even one spec -- confusing peak CFM for operating CFM, or ignoring the static pressure requirement of a filtered enclosure -- can result in a thermal failure that has nothing to do with the fan being defective.
The Cost of a Spec Misread at the Sourcing Stage
The mismatch rarely shows up immediately. A fan running near the edge of its pressure rating might move enough air to pass a bench test but throttle airflow significantly once installed inside a chassis with real cable routing, filter media, and adjacent boards creating resistance. By that point, the PCB layout is fixed, the enclosure is tooled, and swapping to a higher-pressure or higher-CFM variant requires re-qualification. Reading the datasheet correctly the first time is cheaper than discovering the problem at system integration.
Datasheets also communicate what the manufacturer tested, not necessarily every condition an application imposes. A fan rated at a specific dBA was measured in an anechoic1 chamber at a single operating point -- real installations add duct resonance, vibration coupling, and inlet turbulence that no datasheet can fully capture. Knowing what the numbers represent, and where they have limits, is what turns a datasheet from a sales document into a useful engineering input.
What Does the Airflow Number (CFM or m³/h) Actually Tell You?
The airflow spec is the number most people read first, and the one most often misapplied.
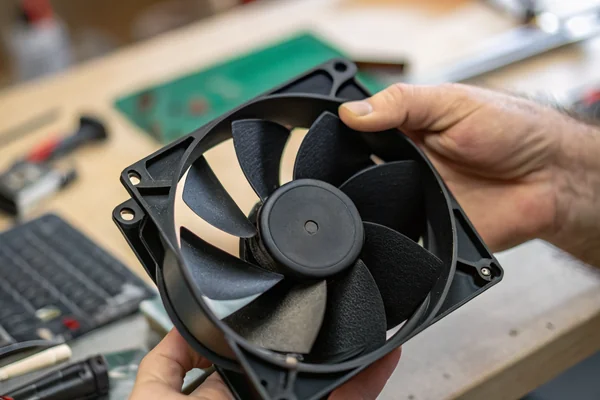
Airflow -- measured in CFM (cubic feet per minute) or m³/h (cubic meters per hour) -- represents the maximum volume of air a fan can move under free-air conditions with zero system resistance, which means real operating airflow through any enclosure with real restrictions will always be lower than this number.
Why Free-Air CFM Is a Ceiling, Not an Operating Guarantee
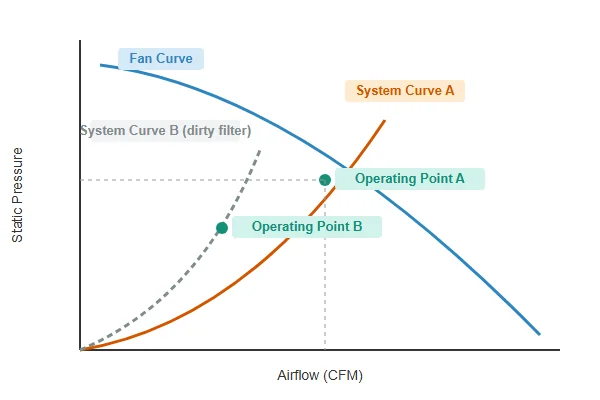
The free-air CFM rating is taken at zero static pressure -- no filter, no restriction, no duct -- which is a test condition that almost no real application actually replicates. The moment a fan is mounted inside a chassis, behind a filter, or in series with a heat sink, system resistance pushes the operating point left along the P-Q curve, reducing actual airflow delivered. How much it drops depends on the system's resistance curve, which is why the CFM figure on the datasheet needs to be read alongside the static pressure spec and the P-Q curve, not in isolation.
Unit conversion matters for international sourcing: 1 CFM ≈ 1.699 m³/h, so a 50 CFM fan is approximately 85 m³/h. Different regions and different end markets tend to use different units, and datasheets from different manufacturers may use either, so checking which unit a given datasheet is reporting before comparing fans across suppliers avoids a straightforward numerical error.
| Unit | Conversion | Common Use Region |
|---|---|---|
| CFM (ft³/min) | 1 CFM = 1.699 m³/h | North America |
| m³/h | 1 m³/h = 0.589 CFM | Europe, Asia |
| L/s | 1 L/s = 2.119 CFM | Engineering/scientific |
What Does the Static Pressure Rating Tell You About System Fit?
Static pressure is the spec that separates fans suitable for restrictive applications from those that aren't.
Static pressure2 -- measured in Pascals (Pa) or inches of water column (inH₂O) -- is a fan's ability to push air against resistance, and it determines whether a fan can maintain meaningful airflow through filters, narrow ducts, or densely packed enclosures where a high-CFM but low-pressure fan would stall.
Why Pressure Rating Is the Spec That Actually Governs Restrictive Applications
A fan with excellent free-air CFM but low static pressure can stall almost entirely once placed behind a filter with meaningful resistance. The pressure rating tells you how steep the fan's P-Q curve is at the high-resistance end of its operating range -- a fan with high static pressure rating maintains useful airflow further into restrictive conditions than a fan of similar diameter optimized for free-air volume. For telecom chassis, medical equipment with HEPA filtration, or any enclosure with a long internal airflow path, static pressure is the governing spec, not peak CFM.
The relationship between the two units is fixed: 1 inH₂O ≈ 249 Pa. Most industrial datasheets list Pa; some North American and PC fan datasheets use inH₂O. A 2.0 inH₂O fan and a 498 Pa fan are the same fan -- knowing the conversion prevents treating one as higher-rated than the other.
How Should You Read the Noise and Speed Specs Together?
Noise and RPM are not independent specs -- one directly drives the other, and the datasheet's single dBA figure hides that dependency.
Noise (dBA) and rotational speed (RPM) are inseparable on a fan datasheet -- higher RPM produces more airflow and more noise simultaneously, and the listed dBA figure is measured at one specific operating speed, meaning a PWM-controlled fan running at different speeds will produce different noise levels than the datasheet figure suggests.
Why the Single dBA Number Needs Context to Be Useful
The dBA3 figure on a datasheet is an A-weighted sound pressure level measured at a defined distance (typically 1 meter) under specific test conditions. It's a point measurement, not a range. A fan that lists 35 dBA at rated RPM may run significantly quieter at 60% PWM duty cycle and significantly louder if driven above rated voltage -- the datasheet number only tells you about one point on the noise-versus-speed curve.
RPM also directly determines operating point on the P-Q curve. A variable-speed fan controlled via PWM doesn't operate at one fixed RPM, which means its actual airflow and pressure delivery shift continuously with duty cycle. For applications where both thermal performance and acoustic requirements must be met across a range of load conditions, checking whether the supplier can provide noise data at multiple speed points -- not just rated speed -- gives a more complete picture.
What Does the P-Q Curve Actually Tell You, and How Do You Use It?
The P-Q curve is the most information-dense single item on a fan datasheet.
The P-Q curve4 plots static pressure (P) against airflow (Q) across the fan's full operating range, and using it correctly means identifying the intersection of this curve with your system's resistance curve -- the actual operating point where the fan will run in your specific application, not in free air.
How to Find Your Real Operating Point From the Curve
The P-Q curve always runs from maximum static pressure at zero airflow (the left vertical axis intercept, where the fan is blocked completely) to maximum airflow at zero static pressure (the right horizontal axis intercept, free-air CFM). Real applications sit somewhere in between, and where exactly depends on the system's resistance.
System resistance increases roughly with the square of airflow velocity through the system, which plots as an upward-curving line from the origin on the same P-Q graph. The intersection of the system resistance curve with the fan's P-Q curve is the actual operating point -- the real airflow delivered and the real pressure the fan is working against. Selecting a fan without plotting this intersection, relying only on the free-air CFM, risks specifying a fan whose operating point falls in a low-efficiency or unstable region of its own curve.
The ANSI/AMCA Standard 2105 defines the laboratory test methodology for generating P-Q curves used for certified aerodynamic performance ratings -- a fan datasheet citing this standard gives confidence that the curve was generated under a controlled, reproducible test protocol.
| P-Q Curve Region | What It Means | Action |
|---|---|---|
| Far left (near stall) | Fan is heavily loaded, airflow near zero | System over-restricted; higher pressure fan or reduce restriction |
| Middle/working zone | Normal operating range, stable flow | Target operating point for most applications |
| Far right (near free air) | Minimal restriction, maximum flow | Check if pressure capability is being wasted |
Every DC axial fan we produce at our Dongguan facility is validated on our in-house CFM airflow test system and anechoic noise test chamber, generating real P-Q curve data rather than theoretical calculations. If you're trying to identify the right operating point for a specific application -- particularly one with filter restriction or a non-trivial enclosure -- we can review the system resistance picture with you and confirm which fan specification actually fits before you commit to a sample order.
Which Supporting Specs on a Datasheet Are Worth Checking Beyond Airflow and Pressure?
Airflow, pressure, and noise are the primary triangle, but several supporting specs determine whether a fan actually survives in a given application.
Bearing type, operating voltage range, startup voltage, and operating temperature range are the supporting specs most likely to cause field failures if ignored -- a fan that meets the thermal specs but uses the wrong bearing type for the application's duty cycle or ambient temperature can fail well before its rated lifespan.
Bearing Type, Voltage Tolerance, and Temperature Range
Bearing type governs long-term reliability and orientation sensitivity. Sleeve bearings are cost-effective but degrade faster in high-temperature or continuously-on applications and are orientation-sensitive (horizontal shaft preferred). Ball bearings tolerate higher temperatures, any mounting orientation, and higher duty cycles at the cost of some additional noise at lower speeds. Fluid dynamic bearings offer a performance middle ground -- quieter than ball bearings at low speeds, more durable than sleeve bearings in challenging conditions.
Operating voltage range matters in applications where supply voltage fluctuates or where a fan needs to start reliably at cold temperatures. Startup voltage -- the minimum voltage at which a fan will reliably begin rotating from rest -- is different from the operating voltage range, and it matters in PWM-controlled designs where the fan may be commanded to restart after being stopped. An under-specified startup voltage leads to fans that stop during a low-duty-cycle command and don't restart when the thermal load returns.
Operating temperature range sets the limit on where a fan can be used, affecting both the motor and the bearing lubricant. Industrial and automotive applications routinely push ambient temperatures above the range where standard PC-grade fans are rated, making the temperature spec a selection gate, not just a background detail.
How Should You Approach Sourcing a Fan When the Datasheet Leaves Gaps?
Datasheets answer standard questions but rarely document everything a specific application needs to know.
When a standard datasheet doesn't provide the specific operating-point data your application requires -- noise at multiple speed points, P-Q curve data at non-standard voltages, or derating curves for elevated ambient temperature -- the right approach is to request application-specific test data from the supplier, not to extrapolate beyond what the published spec covers.
What to Ask a Supplier When the Standard Datasheet Isn't Enough
Most fan datasheets are produced for the general market and tested at nominal voltage and room temperature. Applications with tighter margins -- high ambient temperature, noise-sensitive enclosures, or variable-speed control across a wide RPM range -- often need data that isn't in the standard document. Legitimate suppliers with in-house test capability can generate P-Q curves at off-nominal voltages, provide noise measurements at multiple PWM points, or confirm operating behavior at temperature extremes -- but only if you ask for it explicitly at the sourcing stage rather than after prototypes are delivered.
Custom fan specifications are also worth considering when a standard datasheet product represents a compromise between your application's requirements and whatever the general market needed. Blade geometry, voltage range, and connector type can often be adjusted for volume orders, and those adjustments need to happen at the design stage, not as a retrofit.
FAQ
Is free-air CFM or operating CFM the more useful number for system design?
Operating CFM -- the airflow at your application's actual resistance -- is the useful number, but it requires the P-Q curve and a system resistance estimate to calculate. Free-air CFM is only directly useful for completely unrestricted applications, which are rare in practice.
What's a typical static pressure difference between a standard open-air fan and one designed for restrictive applications?
This varies significantly by fan size and design, but fans intended for open-air cooling often have static pressure ratings below 100 Pa, while fans optimized for restrictive applications (filtered chassis, dense electronics enclosures) may be rated from 200 Pa to well above 400 Pa at comparable sizes.
Why do some datasheets list voltage as a single value while others list a range?
Single-voltage listings indicate the spec was measured at nominal voltage. A voltage range indicates the fan is rated to operate reliably across that span -- important for applications with variable or unstable supply rails, or for PWM voltage-controlled designs.
Does a higher RPM fan always deliver more airflow than a lower RPM fan of the same size?
Not necessarily -- RPM interacts with blade pitch, blade count, and diameter to determine airflow. A higher-RPM fan with shallow pitch may deliver less airflow than a lower-RPM fan with steeper pitch, which is why comparing RPM across different models without looking at the P-Q curve can be misleading.
How far should the operating point be from the stall region of the P-Q curve?
There's no universal rule, but targeting an operating point in the middle third of the curve is a reasonable default. Operating too close to the stall point (low airflow, high pressure end) can produce flow instability and excess noise; operating at the extreme free-air end wastes pressure capability and may indicate the fan is oversized for the application.
Can I use a single fan's dBA spec to compare noise across fans from different manufacturers?
With caution -- the dBA figure is only comparable if both fans were tested at the same measurement distance, the same operating voltage, and under the same test standard. Manufacturers using different measurement protocols will produce numbers that can't be directly compared without knowing the test methodology behind each.
What's the difference between rated voltage and startup voltage, and why does it matter for PWM control?
Rated voltage is the supply voltage at which the fan's listed specs apply. Startup voltage is the minimum voltage needed for the fan to reliably begin spinning from a stopped state. In PWM applications, if the control signal drops the effective voltage below startup voltage, the fan may stop and fail to restart when the command returns -- which is a thermal failure mode, not a fan defect.
Is bearing type always listed on a datasheet, or do I need to ask the supplier?
Bearing type is frequently listed, but not universally. When it isn't specified and application longevity or orientation sensitivity matters, asking the supplier directly is the right step -- don't assume ball bearing construction from a price point or product photo alone.
A cooling fan datasheet is a dense document in a compact format, but every number is answering a specific question about how that fan behaves under specific conditions. Reading it correctly -- especially the P-Q curve alongside the airflow and pressure specs -- turns fan selection from guesswork into a reasoned engineering decision. Herays has designed and manufactured DC axial fans from our Dongguan facility for over 20 years, with ISO 9001, ISO 14001, IATF 16949, and QC 080000 certification and in-house CFM and anechoic test capability. If a datasheet leaves questions open for your application, we're glad to work through the specifics with you.
An anechoic chamber is a room designed to completely absorb sound reflections, creating a free-field acoustic environment -- dBA measurements taken in anechoic conditions represent the fan's own acoustic output without the influence of room resonance or reflective surfaces, which is why this test environment is the standard reference for fan noise ratings. ↩
Static pressure is the pressure a fan can develop against a sealed or restricted outlet, expressed in Pascals (Pa) or inches of water column (inH₂O) -- it determines whether a fan can sustain airflow through a system that imposes resistance, rather than only moving air in open conditions. ↩
dBA (A-weighted decibels) is a sound pressure level measurement filtered to approximate the frequency response of human hearing, weighting mid-range frequencies more heavily than very low or very high frequencies -- it is the standard unit for fan noise specifications because it correlates better with perceived loudness than an unweighted dB measurement. ↩
A P-Q curve (also called a fan curve) plots static pressure output against volumetric airflow across the full operating range of a fan -- it is the primary tool for predicting real-world operating performance because it shows how both pressure and airflow change together as system resistance varies. ↩
ANSI/AMCA Standard 210 defines the laboratory test methodology for measuring fan aerodynamic performance and generating certified P-Q curves -- datasheets referencing this standard indicate the curve was produced under a controlled, reproducible protocol rather than under unspecified internal test conditions. ↩

Liang
I've been working with DC fans for 30 years — long enough to have seen the industry evolve from basic sleeve bearing designs to today's high-efficiency, IP68-rated systems built for the harshest environments imaginable. I founded Herays because I believed manufacturers and engineers deserved a supplier who could talk technical from day one. Not just hand over a datasheet, but actually help you select the right fan for your thermal load, your enclosure, your certification requirements. Most of what I write here comes directly from problems I've solved on the factory floor or in customer applications — medical devices, laser equipment, industrial automation, you name it. If it involves moving air efficiently and reliably, I've probably spent time thinking about it. When I'm not obsessing over airflow curves, I'm usually helping a customer figure out why their cooling system isn't performing the way their simulation said it would.
View all posts by Liang