A fan datasheet packs a dozen numbers onto one page, and it's entirely possible to compare two fans, pick the "better" one on paper, and still end up with worse real-world cooling performance -- because reading these specs correctly takes more than just comparing headline figures.
A cooling fan datasheet's key specifications -- airflow (CFM/m³h), static pressure (Pa/inH₂O), noise (dBA), and speed (RPM) -- only tell the full story when read together and understood in the context of the P-Q curve, which shows how airflow and pressure actually trade off against each other rather than existing as independent maximum figures.
- Airflow (CFM or m³h) and static pressure (Pa or inH₂O) are inversely related on a single fan -- maximum airflow and maximum pressure never occur simultaneously.
- Noise (dBA) figures are typically measured at a specific speed, usually the fan's maximum rated speed, which may not reflect real-world operating noise.
- RPM alone doesn't determine performance -- two fans at the same RPM can have very different airflow and pressure due to blade design differences.
- The P-Q (pressure-airflow) curve is the single most informative piece of data on a fan datasheet, showing real performance across the full operating range.
- Comparing fans using only headline maximum specs, without considering the P-Q curve at your actual operating point, is one of the most common fan selection mistakes.
Understanding how to read past headline numbers into the underlying performance curve clarifies why datasheet literacy genuinely matters for fan selection.
Table of Contents
Why Do CFM and Static Pressure Numbers on a Datasheet Never Both Represent "Maximum Performance" at Once?
Understanding this inverse relationship is the single most important concept for reading a fan datasheet correctly.
A fan's maximum CFM figure is measured with zero external resistance (completely free air), while its maximum static pressure figure is measured at zero airflow (completely blocked outlet) -- these are two different, mutually exclusive operating conditions, not simultaneous capabilities the fan delivers at once.
Why This Inverse Relationship Trips Up Datasheet-Only Comparisons
Because maximum CFM and maximum static pressure are measured at opposite extremes of the fan's operating range, a fan with impressively high numbers for both specs isn't necessarily going to deliver both simultaneously at your actual operating point, which sits somewhere between these two extremes depending on your system's specific airflow resistance. This is why comparing two fans' maximum CFM and maximum static pressure figures independently, without understanding where your actual application falls on each fan's performance curve, can lead to a selection that underperforms in practice despite looking superior on paper.
What Does the P-Q (Pressure-Airflow) Curve Actually Show, and Why Does It Matter So Much?
The P-Q curve is the datasheet element that resolves the CFM-versus-pressure tradeoff into something actually usable.
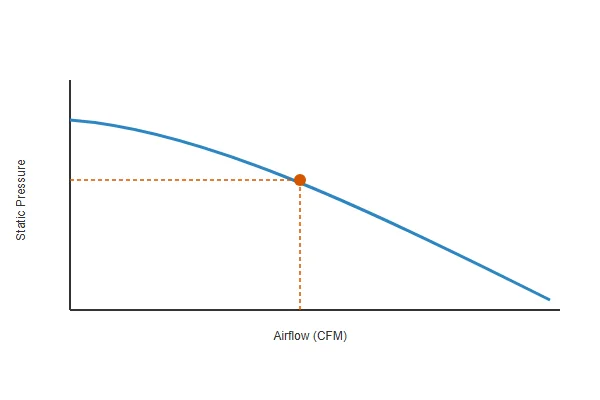
A P-Q curve plots a fan's airflow output across the full range of static pressure it might encounter, from zero resistance (maximum CFM) to maximum resistance (zero CFM) -- this single curve shows you exactly how much airflow the fan actually delivers at your system's specific resistance level, which headline CFM and pressure specs alone cannot show.
Why the P-Q Curve Is the Closest Thing to a Complete Performance Picture on a Datasheet
Every other spec on a fan datasheet represents a single point measurement under specific conditions, while the P-Q curve shows performance across the fan's entire operating range, letting you find the actual airflow a fan will deliver once you know (or estimate) your system's static pressure resistance -- this is genuinely more useful than any single spec for predicting real-world performance. This is why experienced engineers specifically request or calculate P-Q curve data rather than relying on headline CFM and pressure figures alone when comparing fans for a specific application.
How Should You Actually Interpret a Fan's Noise (dBA) Rating on a Datasheet?
Understanding measurement context prevents a common noise comparison mistake.
A fan's dBA rating is typically measured at a specific distance (often 1 meter) and at a specific speed (usually the fan's maximum rated RPM), meaning the published figure often represents worst-case noise rather than the noise level you'll experience if the fan runs at a lower, more typical operating speed.
Why Maximum-Speed Noise Figures Can Overstate Real-World Experience
Since most fans in well-designed systems don't run continuously at their absolute maximum rated speed, a datasheet's dBA figure -- measured at that maximum speed -- often represents a worse-case noise scenario than what a system actually experiences during typical operation at a lower, thermally-adequate speed. This is why comparing dBA figures across fans is most meaningful when comparing figures measured at the same speed point, ideally your application's actual expected operating speed, rather than each fan's own maximum-speed rating.
Does RPM Alone Actually Tell You Much About a Fan's Real Performance?
Understanding why RPM is a less useful standalone comparison metric than it might seem.
RPM alone doesn't reliably predict airflow or pressure performance, since two fans spinning at the same RPM can have meaningfully different airflow and static pressure output depending on blade design, blade count, and diameter -- RPM is more useful as a reference point alongside other specs than as a standalone performance indicator.
Why Blade Design Differences Make RPM a Weak Standalone Comparison Metric
A fan's airflow output results from the combination of RPM, blade geometry, blade count, and diameter working together, meaning comparing two fans purely by RPM ignores the blade design differences that can produce substantially different actual airflow and pressure performance at that same rotational speed. This is why RPM should be read alongside CFM, static pressure, and ideally P-Q curve data, rather than treated as a standalone indicator of which fan performs better.

What's the Practical Process for Actually Using a P-Q Curve to Select the Right Fan?
Translating P-Q curve reading into an actionable fan selection process.
Estimate or measure your system's static pressure resistance at your target airflow, then check where that resistance point falls on each candidate fan's P-Q curve to see the actual airflow each fan would deliver in your specific system -- the fan that delivers adequate airflow at your actual resistance point, not the fan with the highest headline CFM, is the better choice.
Why This Process Catches Selection Mistakes a Headline-Spec Comparison Would Miss
Following this process specifically prevents the common mistake of selecting a fan based on impressive maximum CFM that turns out to deliver inadequate airflow once installed in a system with meaningful resistance, since the P-Q curve reveals that fan's actual performance at your resistance level rather than its unreachable free-air maximum. This is why P-Q curve-based selection, even using rough system resistance estimates, produces more reliable real-world results than comparing headline specs across candidate fans.

What Other Datasheet Details Are Easy to Overlook But Actually Matter?
Beyond the headline specs, several secondary datasheet details deserve attention for a complete evaluation.
Bearing type, rated voltage range, operating temperature range, and MTBF or L10 lifespan data are all datasheet elements that matter for real-world suitability but are frequently overlooked in favor of focusing purely on airflow and pressure specs -- a fan with excellent airflow performance but an unsuitable bearing type or temperature rating for your application is still the wrong choice.
Why a Complete Datasheet Review Goes Beyond Just Airflow Performance
Airflow and pressure performance only matter if the fan can actually survive and operate reliably in your specific application's voltage, temperature, and duty cycle conditions, making these secondary specifications genuinely important gatekeeping criteria rather than minor details to skim past once airflow specs look adequate. This is why a thorough datasheet review checks these secondary specifications explicitly, rather than assuming a fan with good airflow numbers is automatically suitable across every other dimension.
Our DC fan datasheets include genuine P-Q curve data across our axial and blower product lines, manufactured at our Dongguan facility under ISO 9001 certification. With over 20 years of production experience, we help customers read past headline specs to identify the actual fan performance their specific system resistance and operating conditions require.
How Should You Actually Compare Datasheets From Different Manufacturers Using Different Test Standards?
Cross-manufacturer comparison introduces a methodology question worth understanding before trusting a side-by-side comparison.
Different manufacturers sometimes use different test standards or measurement conditions for airflow, pressure, and noise figures, meaning a direct numerical comparison across manufacturers can be misleading unless you confirm both datasheets used equivalent test methodology and conditions.
Why Test Standard Differences Can Silently Distort Cross-Manufacturer Comparisons
Two fans with identical published CFM figures might have been tested under subtly different conditions -- different ambient temperature, different measurement distance for noise, different test rig configuration for airflow -- that make the numbers not directly comparable despite appearing equivalent on paper. This is why checking the referenced test standard (where published) and, when in doubt, requesting clarification on test methodology from each manufacturer adds a meaningful layer of confidence before treating cross-manufacturer datasheet numbers as directly comparable.
FAQ
Do all fan manufacturers publish P-Q curve data?
Not universally -- some manufacturers publish only headline CFM and static pressure figures, making it worth specifically requesting P-Q curve data for serious comparison work, especially for applications with meaningful airflow resistance.
How do I estimate my system's static pressure resistance without specialized equipment?
Rough estimation from ducting length, bends, filters, and obstruction density can provide a starting estimate, though actual measurement with a manometer or similar instrument gives more reliable data for critical applications.
Is a higher-RPM fan always going to be louder than a lower-RPM fan?
Generally yes as a rough trend, but blade design significantly affects the noise-to-RPM relationship, meaning this isn't a reliable rule for precise comparison between different fan models.
Can I compare P-Q curves between fans of different physical sizes fairly?
You can compare the actual airflow at your resistance point regardless of size, though larger fans achieving similar airflow at lower RPM often do so more quietly, which is worth factoring into the comparison alongside the raw P-Q performance.
Does temperature affect a fan's actual P-Q curve performance in the field?
Yes, to some degree -- air density changes with temperature and altitude, which can shift real-world performance somewhat from the P-Q curve's typically standard-condition test data, though this effect is usually secondary to the primary resistance-matching consideration.
Is it worth requesting custom P-Q curve testing from a supplier for a critical application?
For genuinely critical or high-volume applications, requesting testing at your specific operating conditions can be worthwhile, providing more application-specific confidence than standard published curves alone.
Reading a fan datasheet correctly comes down to understanding the P-Q curve's tradeoff relationship, not just comparing headline CFM and pressure numbers. At Herays, our Dongguan facility manufactures DC fans with genuine P-Q curve documentation, backed by over 20 years of production experience under ISO 9001 certification. If you're comparing fans for a specific application, we're glad to help you read the data correctly for your actual operating conditions.

Liang
I've been working with DC fans for 30 years — long enough to have seen the industry evolve from basic sleeve bearing designs to today's high-efficiency, IP68-rated systems built for the harshest environments imaginable. I founded Herays because I believed manufacturers and engineers deserved a supplier who could talk technical from day one. Not just hand over a datasheet, but actually help you select the right fan for your thermal load, your enclosure, your certification requirements. Most of what I write here comes directly from problems I've solved on the factory floor or in customer applications — medical devices, laser equipment, industrial automation, you name it. If it involves moving air efficiently and reliably, I've probably spent time thinking about it. When I'm not obsessing over airflow curves, I'm usually helping a customer figure out why their cooling system isn't performing the way their simulation said it would.
View all posts by Liang