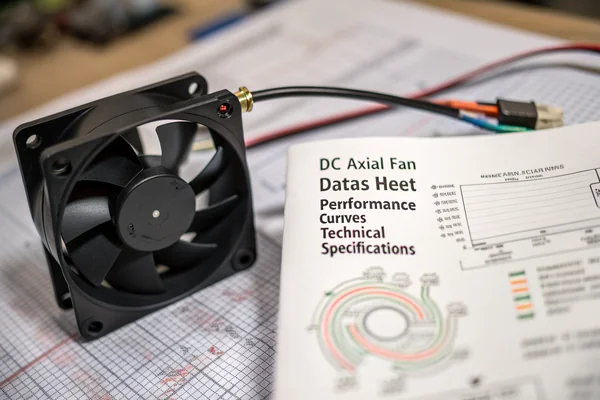
Two fans can share nearly identical marketing copy and perform completely differently once installed. The datasheet is where that difference actually shows up, if you know what to look for.
Reading a DC axial fan datasheet correctly means understanding the P-Q curve, the noise-versus-speed relationship, and temperature derating together, rather than picking a single headline CFM number and assuming it tells the whole story.
- A datasheet's headline CFM number describes free-air performance, not what the fan delivers against your system's actual resistance -- the P-Q curve is where the real answer lives.
- Noise ratings are almost always measured at a specific speed and distance, which means comparing dBA numbers across datasheets without matching test conditions is misleading.
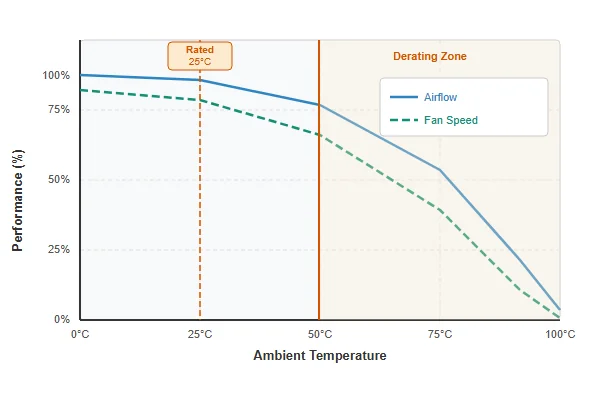
- Temperature derating curves show how much performance drops as ambient temperature rises, and skipping this section is a common way to under-provision cooling.
- The most common datasheet mistakes involve reading a single number in isolation instead of understanding how the curves interact at your actual operating point.
- Missing information -- no P-Q curve, no derating data, no bearing life figures -- is itself useful information about how much engineering rigor went into a fan's specification.
Getting real value from a fan datasheet means reading it as a system of related curves, not a list of standalone specs.
Table of Contents
Why Does the Datasheet Matter More Than the Marketing Copy?
Marketing copy describes a fan's best case. The datasheet describes its actual behavior across conditions.
The datasheet matters more than marketing copy because it's the only place that shows how a fan actually performs across a range of conditions -- resistance, temperature, speed -- rather than a single best-case headline number chosen for a spec sheet comparison.
What the Datasheet Is Actually For
A product page might advertise "high airflow" or "whisper quiet" without context, while the datasheet has to specify the actual conditions those claims apply under. Engineers comparing fans for a real application need the underlying curves -- not the marketing summary -- because real installations rarely operate at the ideal free-air, standard-temperature conditions marketing claims are usually based on.
| Datasheet Section | What It Actually Tells You |
|---|---|
| P-Q curve | Airflow at your system's actual resistance, not just free air |
| Noise vs speed | Real noise at the speed you'll actually run |
| Temperature derating | How much performance you lose at your actual ambient temperature |
How Do You Actually Read a P-Q Curve?
The P-Q curve is the single most important chart on most fan datasheets, and also the most commonly misread.
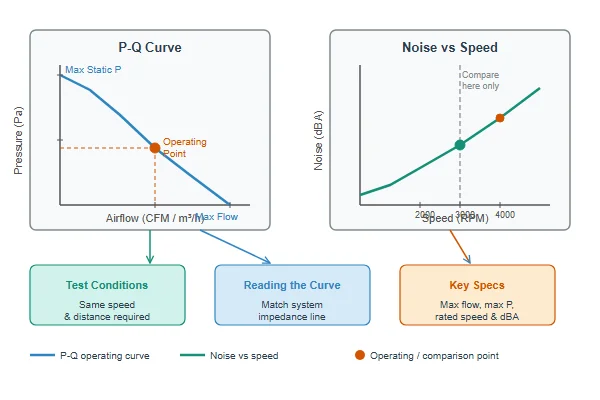
Read a P-Q curve1 by finding where your system's resistance curve intersects the fan's curve -- that intersection point, not the curve's starting free-air CFM, is the airflow your system will actually get.
Finding Your Real Operating Point
The P-Q (pressure-airflow) curve plots how much air the fan delivers at increasing levels of static pressure resistance, starting at maximum CFM with zero resistance and dropping toward zero CFM at the fan's maximum pressure capability. Your actual system -- with its own resistance from filters, ducts, or enclosure restrictions -- has its own resistance curve, and where the two curves cross is your real-world operating point. Reading only the free-air CFM number and ignoring this intersection is the single most common way engineers overestimate a fan's real performance.
What Is the Noise-vs-Speed Graph Really Telling You?
Noise specs are one of the most frequently misunderstood numbers on a fan datasheet.
The noise-versus-speed graph shows how dBA output changes across the fan's speed range, and the number that matters is the noise at your actual intended operating speed -- not the single maximum-speed dBA figure often printed as the headline spec.
Why the Single dBA Number Misleads
Manufacturers typically test noise at a fan's rated maximum speed and a specific measurement distance, but many applications run fans at reduced speed most of the time via PWM control, where actual noise is meaningfully lower. Comparing headline dBA numbers between two fans without confirming they were measured at the same speed and distance is comparing numbers that aren't actually equivalent.
How Much Does Temperature Actually Derate Fan Performance?
Temperature derating is one of the most commonly skipped sections on a datasheet, and one of the most consequential to skip.
Fan performance -- airflow, and sometimes maximum speed -- typically derates as ambient temperature rises above the fan's standard test condition, which means a fan sized around room-temperature specs can underperform meaningfully once installed in a genuinely hot application.
Why Skipping This Section Causes Real Problems
Air density decreases as temperature rises, which reduces the actual mass of air a fan moves per rotation even at the same CFM rating measured at standard conditions. Beyond a certain ambient temperature, some fans also reduce maximum speed to protect internal electronics from thermal stress, further cutting delivered airflow. A datasheet's derating curve shows exactly how much performance to expect at your actual ambient temperature -- skipping it and assuming standard-condition numbers apply is a common, avoidable source of under-provisioned cooling.
What Are the Most Common Datasheet Reading Mistakes?
A handful of mistakes account for most real-world datasheet misreadings.
The most common datasheet mistakes are reading free-air CFM as if it applies at your actual system resistance, comparing noise numbers measured under different conditions, ignoring temperature derating, and treating MTBF as a guaranteed individual unit lifespan rather than a population statistic.
Why These Mistakes Keep Happening
Each of these mistakes comes from reading a single number in isolation rather than understanding what conditions that number was measured under. A fan's true performance in your application depends on the intersection of several curves -- pressure, speed, temperature -- evaluated at your actual operating conditions, not any single headline figure taken at face value. Slowing down to check the test conditions behind each number is the practical fix for nearly all of these mistakes.
What's Missing From Most Datasheets That You Should Ask For?
Standard datasheets often leave out information that matters for serious engineering decisions.
Many standard datasheets omit real-world detail like performance at non-standard voltages, bearing life data at elevated temperature, or acoustic data at multiple speeds -- worth asking a supplier for directly when your application doesn't match the datasheet's default test conditions.
Filling the Gaps a Standard Datasheet Leaves
A datasheet built for broad marketing use often shows performance at one standard voltage, one standard temperature, and one or two speed points, even though real applications frequently deviate from all three. A supplier who can provide additional data -- P-Q curves at your specific operating voltage, bearing life at your actual ambient temperature, noise at your intended PWM duty cycle -- is giving you a much more accurate picture than the standard published sheet alone.
How Do You Compare Datasheets From Two Different Suppliers Fairly?
Fair comparison requires normalizing for testing methodology differences between suppliers, not just reading the numbers side by side.
Compare datasheets fairly by confirming both were tested under matched or comparable conditions -- same voltage, similar ambient temperature, same measurement methodology for noise and airflow -- and by requesting clarification from each supplier when methodology isn't clearly stated.
Why Apples-to-Apples Takes Extra Work
Two suppliers can test and report performance data using genuinely different methodologies -- different anemometer techniques, different noise measurement distances, different accelerated life testing assumptions -- which means their published numbers aren't automatically comparable even when they look similar on the page. Asking each supplier directly how their key numbers were measured, and requesting data at matched conditions where possible, is the only reliable way to compare fans across different datasheets.
We've published and explained fan datasheets to engineering customers for over 20 years, and the questions we get most often are about exactly the gaps standard datasheets leave -- performance at non-standard voltages, real bearing life at elevated temperature, noise at reduced PWM speeds. Every number on our datasheets comes from our own in-house CFM, static pressure, anechoic noise, and life-testing equipment as part of our ISO 9001 and IATF 16949 quality process, and we can provide supplementary data at your specific operating conditions on request.
FAQ
Why do two fans with the same CFM rating perform differently in my application?
Usually because their P-Q curves differ -- one fan may maintain airflow better against resistance even with the same free-air CFM rating as another that drops off faster under load.
Is a higher static pressure rating always better than a higher CFM rating?
Not universally -- it depends on your system's actual resistance. High static pressure matters more behind filters or restrictive enclosures; high CFM matters more in open-air applications.
How do I find a fan's P-Q curve if it's not on the datasheet?
Request it directly from the supplier. A supplier that can't provide a P-Q curve on request may not have tested the fan as rigorously as one that can.
What voltage should datasheet performance numbers be measured at?
Ideally the fan's rated nominal voltage, but confirm this explicitly, since some datasheets test at a slightly different voltage that can make performance look better than it will be at your actual supply voltage.
Does a datasheet's noise rating account for tonal or resonant noise, not just loudness?
Not usually. dBA measures overall loudness but doesn't capture whether a fan has an annoying tonal or resonant quality, which is often better evaluated by listening to a sample than by reading the datasheet alone.
How much should I trust a datasheet from a supplier I haven't worked with before?
Treat it as a starting point and ask for supporting test data or sample units to validate independently, especially for applications where fan performance genuinely matters to the end product's success.
A fan datasheet is only as useful as your ability to read the curves together rather than in isolation, and the gap between a good and a mediocre reading of the same datasheet can be the difference between a cooling design that works and one that quietly underperforms. At Herays, our Dongguan facility generates every datasheet figure from real in-house testing under ISO 9001 and IATF 16949 certification, and we're glad to provide additional data at your specific operating conditions when the standard sheet doesn't cover them.
A fan curve (or P-Q curve) plots a fan's airflow output against static pressure resistance. The point where a fan's curve intersects a system's own resistance curve determines the actual airflow that system will receive in real operation. ↩

Liang
I've been working with DC fans for 30 years — long enough to have seen the industry evolve from basic sleeve bearing designs to today's high-efficiency, IP68-rated systems built for the harshest environments imaginable. I founded Herays because I believed manufacturers and engineers deserved a supplier who could talk technical from day one. Not just hand over a datasheet, but actually help you select the right fan for your thermal load, your enclosure, your certification requirements. Most of what I write here comes directly from problems I've solved on the factory floor or in customer applications — medical devices, laser equipment, industrial automation, you name it. If it involves moving air efficiently and reliably, I've probably spent time thinking about it. When I'm not obsessing over airflow curves, I'm usually helping a customer figure out why their cooling system isn't performing the way their simulation said it would.
View all posts by Liang